💡 Direct Answer & Executive Summary (Cardiovascular Cardiac Output Solver)
Definition: Calculate human Cardiac Output (CO), Cardiac Index (CI), Stroke Volume (SV), and Cardiac Power Output (CPO) using the mechanical HR×SV method or the clinical Fick Oxygen Principle.
Governing Math Formula: Mechanical Formula: CO = (HR × SV) / 1,000 (L/min). Fick Oxygen Principle: CO = VO2 / (CaO2 - CvO2) = VO2 / [13.4 × [Hb] × (SaO2 - SvO2)]. Cardiac Index: CI = CO / BSA.
Target Applications: Provides real-time quantitative solutions in Biology for students, engineers, researchers, and finance professionals.
Cardiovascular Cardiac Output Solver: Hemodynamics, Fick Principle & Clinical Guide
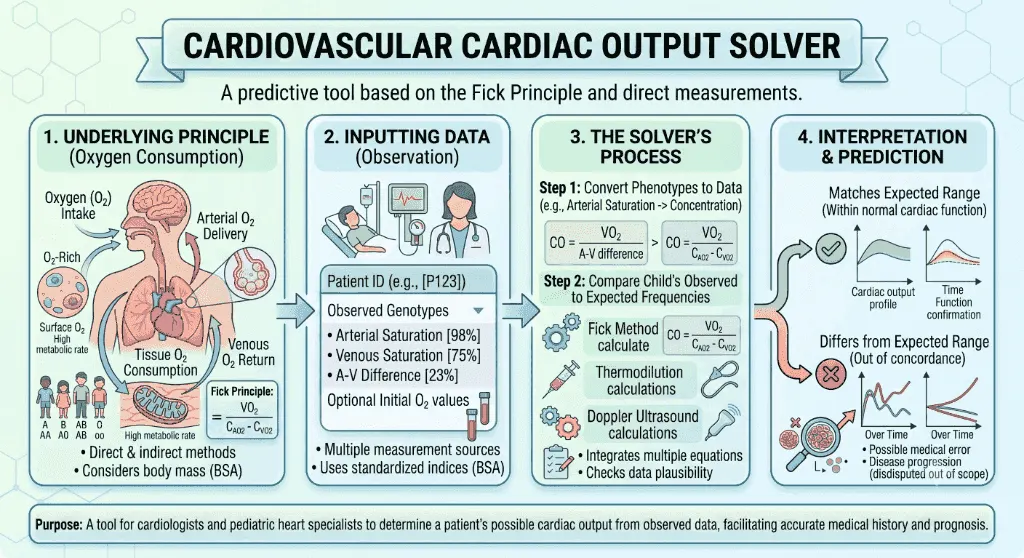
1. Introduction
The human heart is the biological engine that powers all aerobic cellular metabolism. Every minute, the left ventricle contracts between and times, propelling liters of oxygenated blood through a vascular network to nourish vital organs.
In clinical medicine and cardiovascular physiology, Cardiac Output () is the foundational metric of circulatory performance. When a patient collapses in the Intensive Care Unit from cardiogenic shock, cardiac output plummets, starving the brain and kidneys of life-sustaining oxygen. Conversely, during septic shock, systemic vasodilation forces the heart into a high-output hyperdynamic state, demanding precise hemodynamic titration.
How do clinicians and researchers measure the volume of blood pumped per minute? How does the Fick Oxygen Principle calculate cardiac output from blood gas saturation? How is cardiac performance normalized for patients of different heights and weights?
This comprehensive guide breaks down the physical laws, mathematical formulas, diagnostic modalities, and clinical management strategies governing human cardiac output.
flowchart LR
    HEART["🫀 Myocardial Contraction
Heart Rate (HR) × Stroke Volume (SV)"] --> PUMP["🩸 Global Blood Flow (CO)
Normal Resting: 4.0 - 8.0 L/min"]
    PUMP --> NORM["📏 Body Surface Area Normalization
Cardiac Index (CI) = CO / BSA
Target: 2.5 - 4.0 L/min/m²"]
    NORM --> CLINIC["🏥 Hemodynamic Management
Inotropes, Vasopressors & Mechanical Circulatory Assist"]
2. Definitions
2.1 Simple Everyday Definition
Cardiac Output () is the total volume of blood pumped by the left ventricle into the aorta in one minute, typically measured in Liters per minute ().
2.2 Formal Technical Definition
Cardiac output is the mathematical product of the heart's chronotropic rate and its stroke ejection volume:
Where:
- is the Heart Rate in ventricular beats per minute ().
- is the Stroke Volume in milliliters per beat (), defined by the difference between End-Diastolic Volume () and End-Systolic Volume (): .
According to the Fick Principle (conservation of mass), cardiac output can be derived from steady-state oxygen consumption:
Where is the rate of whole-body oxygen consumption (), and is the arteriovenous oxygen content difference ().
2.3 Vivid Real-World Analogies
The Municipal Water Reservoir Pump:
Think of the heart as a high-capacity municipal water pump. The stroke volume is the volume of water pushed into the pipeline during each stroke of the piston (), and the heart rate is how many times the piston fires per minute (). The output is the total water volume flowing through the city's pipes each minute ().
The Amazon Delivery Fleet (Global Oxygen Delivery, ):
Imagine an express logistics network delivering packages (oxygen) to millions of homes (body tissues). The delivery volume () depends on how many delivery vans leave the depot per minute (Cardiac Output) and how many packages each van carries (Arterial Oxygen Content, ).
3. History & Scientific Milestones
The understanding of cardiac output evolved from classical anatomical discovery to cutting-edge bedside pulmonary artery thermodilution and ultrasound speckle tracking.
timeline
    title Milestones in Cardiovascular Hemodynamics
    1628 : William Harvey : Discovers systemic circulation of blood pumped by the heart
    1870 : Adolf Fick : Formulates the Fick Principle of organ blood flow & gas exchange
    1895 : Otto Frank : Demonstrates relation between ventricular stretch and contraction
    1914 : Ernest Starling : Defines the Frank-Starling Law of the Heart
    1970 : Jeremy Swan & William Ganz : Introduce balloon-flotation pulmonary artery catheterization
1990s : Doppler Echocardiography : Non-invasive ultrasound cardiac output via LVOT VTI- William Harvey (1628): Published De Motu Cordis, proving that the heart functions as a muscular pump driving a continuous circular flow of blood through a closed vascular system.
- Adolf Fick (1870): Formulated the fundamental conservation of mass principle demonstrating that blood flow through an organ equals the rate of substrate uptake divided by the arteriovenous concentration difference across the organ.
- Otto Frank (1895) & Ernest Starling (1914): Established the Frank-Starling Law of the Heart, proving that increasing ventricular end-diastolic filling (preload) increases myocardial fiber stretch, yielding a proportional increase in stroke volume.
- H.J. Stewart (1897) & W.F. Hamilton (1932): Developed the indicator dilution mathematical equations that established cold saline thermodilution.
- Jeremy Swan & William Ganz (1970): Invented the flow-directed, balloon-tipped Pulmonary Artery Catheter (Swan-Ganz catheter), enabling routine thermodilution cardiac output measurements at the intensive care bedside.
4. Core Concepts & Determinants
graph TD
    CO["🫀 CARDIAC OUTPUT (CO) = HR × SV"]

    CO --> HR["1. Heart Rate (HR)
• SA Node Chronotropy
• Sympathetic / Parasympathetic Tone
• Autonomic Baroreceptors"]
    CO --> SV["2. Stroke Volume (SV)
• Difference: EDV - ESV
• Normal: 60 - 100 mL/beat"]

    SV --> PRE["Preload (EDV)
Venous Return & Frank-Starling Stretch"]
    SV --> INO["Contractility (Inotropy)
Myocyte Calcium & β1-Adrenergic Force"]
    SV --> AFT["Afterload (SVR)
Aortic Impedance & Arterial Tone"]
4.1 The 4 Primary Determinants of Cardiac Output
- Heart Rate (): The frequency of ventricular depolarization. Tachycardia initially raises , but extreme rates () shorten diastolic filling time, reducing stroke volume.
- Preload (End-Diastolic Volume): The resting myocardial wall tension before contraction. Governed by venous return and compliant filling.
- Contractility (Inotropic State): The intrinsic mechanical force generated by the myocardium at any given preload, mediated by intracellular calcium cycling.
- Afterload (Systemic Vascular Resistance): The mechanical resistance opposing ventricular ejection, determined by aortic elasticity and systemic arteriolar vasoconstriction.
4.2 Cardiac Index ()
Because a athlete requires more resting blood flow than a individual, cardiac output is normalized to Body Surface Area ():
- Normal Range:
- Cardiogenic Shock Threshold:
5. Formulas & Mathematical Derivations
5.1 Mechanical Ejection Formula
5.2 The Direct Fick Oxygen Consumption Formula
By the principle of conservation of mass:
Rearranging for Cardiac Output:
Where oxygen contents in are calculated via:
- Arterial Oxygen Content ():
- Mixed Venous Oxygen Content ():
5.3 Cardiac Work & Resistance Formulas
- Mosteller Body Surface Area ():
- Mean Arterial Pressure ():
- Systemic Vascular Resistance ():
- Cardiac Power Output ():
5.4 Variable Reference Table
| Parameter | Symbol | Standard Units | Normal Clinical Range |
|---|---|---|---|
| Cardiac Output | |||
| Cardiac Index | |||
| Heart Rate | |||
| Stroke Volume | |||
| Stroke Volume Index | |||
| Oxygen Consumption | () | ||
| Arterial Oxygen Saturation | |||
| Mixed Venous Saturation | |||
| Hemoglobin Concentration | |||
| Systemic Vascular Resistance | |||
| Cardiac Power Output | () |
6. Step-by-Step Computational Walkthrough
Let us evaluate a patient in the coronary care unit with height , weight , heart rate , and echocardiographic stroke volume .
flowchart TD
    STEP1["Step 1: Calculate Cardiac Output (CO)
CO = (75 bpm × 68 mL) / 1000 = 5.10 L/min"] --> STEP2["Step 2: Calculate Mosteller BSA
BSA = √((175 × 70) / 3600) = 1.845 m²"]
    STEP2 --> STEP3["Step 3: Calculate Cardiac Index (CI)
CI = 5.10 / 1.845 = 2.76 L/min/m²"]
    STEP3 --> STEP4["Step 4: Calculate Stroke Volume Index (SVI)
SVI = 68 / 1.845 = 36.85 mL/m²"]
    STEP4 --> STEP5["Step 5: Clinical Hemodynamic Interpretation
CI (2.76) falls within normal resting range (2.5 - 4.0)"]- Step 1: Compute Cardiac Output ():
- Step 2: Compute Body Surface Area ():
- Step 3: Compute Cardiac Index ():
- Step 4: Compute Stroke Volume Index ():
- Step 5: Clinical Outcome:The patient exhibits normal, stable forward perfusion without evidence of heart failure or low-output shock.
7. Visual Explanations & Hemodynamic Calculation Methods
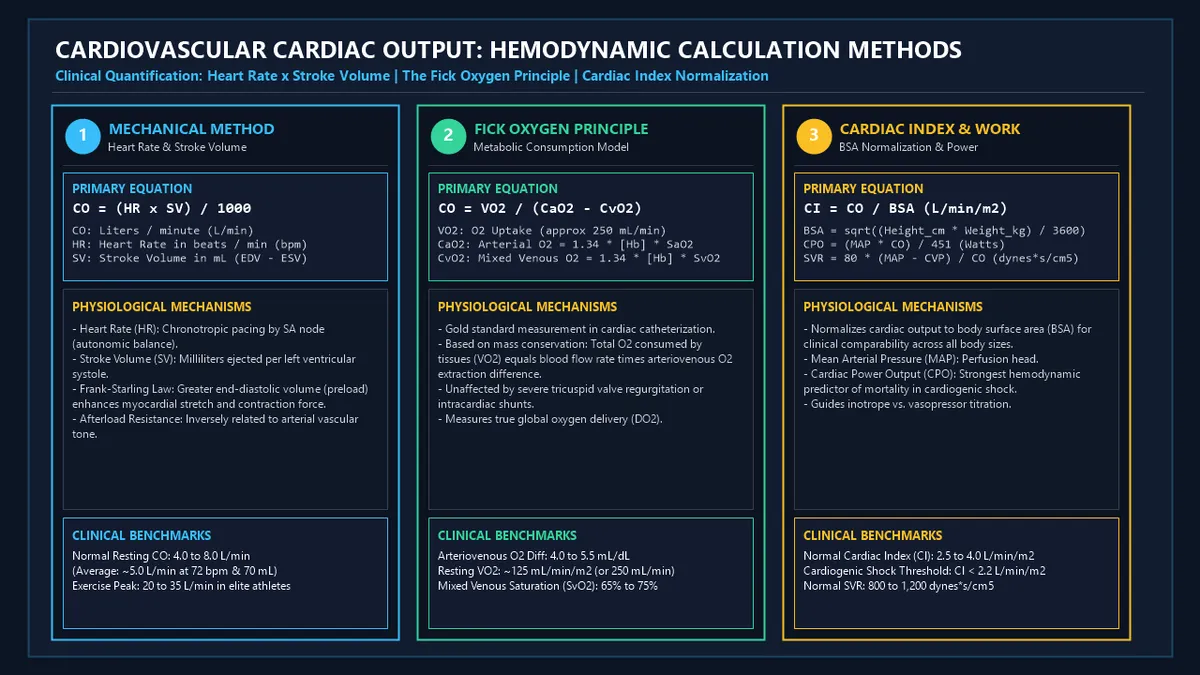
flowchart TD
    MODALITY["Hemodynamic Assessment Modalities"] --> FICK["🫁 Direct Fick Method
O₂ consumption & catheter blood gas"]
    MODALITY --> THERMO["🌡️ Thermodilution (Swan-Ganz)
Stewart-Hamilton temperature curve"]
    MODALITY --> ECHO["🔊 Doppler Echocardiography
LVOT Area × Velocity Time Integral (VTI)"]
    MODALITY --> PULSE["📈 Pulse Contour Analysis
Arterial waveform morphology (PiCCO / FloTrac)"]
8. Comparative & Standards Tables
8.1 Comparison of Cardiac Output Diagnostic Modalities
| Modality | Invasiveness | Gold Standard Basis | Primary Advantages | Key Limitations |
|---|---|---|---|---|
| Direct Fick Method | Invasive (Catheter) | Yes (Reference) | Independent of arrhythmias or valve regurgitation | Requires exact metabolic hood measurement |
| PA Thermodilution | Invasive (Swan-Ganz) | High Clinical Standard | Measures PAP, PCWP, and SVO2 concurrently | Underestimates in severe tricuspid regurgitation |
| Doppler Echo (LVOT VTI) | Non-Invasive (Ultrasound) | Excellent Correlation | Rapid bedside evaluation without vascular access | Operator dependent; poor acoustic window artifacts |
| Pulse Contour (PiCCO) | Semi-Invasive (Arterial) | High | Continuous beat-to-beat monitoring | Requires periodic calibration; affected by aortic stiffness |
| Thoracic Bioimpedance | Non-Invasive (Skin ECG) | Moderate | Wearable, zero infection risk | Prone to noise from pleural effusions and motion |
8.2 Hemodynamic Profiles Across Clinical States
| Clinical State | Cardiac Index () | Mean Arterial Pressure | Systemic Vascular Resistance | Mixed Venous Saturation () |
|---|---|---|---|---|
| Healthy Normal (Rest) | ||||
| Vigorous Aerobic Exercise | ||||
| Cardiogenic Shock | ||||
| Hyperdynamic Septic Shock | ||||
| Hypovolemic Shock |
9. Practical Real-World Applications
Example 1: Differentiating Cardiogenic vs. Septic Shock in the ICU
A patient presents with severe hypotension (, ) and elevated arterial lactate ().
- Hemodynamic Profiling:- If and , the diagnosis is Cardiogenic Shock (requires inotropic Dobutamine and mechanical unloading).- If and , the diagnosis is Distributive Septic Shock (requires vasopressor Norepinephrine to restore vascular tone).
Example 2: Non-Invasive Doppler Echocardiography in Outpatient Cardiology
A cardiologist measures stroke volume across the Left Ventricular Outflow Tract ():
- .
- Pulsed-wave Doppler Velocity Time Integral () .
- .
- At heart rate , .
Example 3: Endurance Athlete Peak Exercise Physiology
An Olympic marathon runner achieves an exercise heart rate of with an athlete's hypertrophied stroke volume of :
- !
- Represents a increase in circulatory delivery over baseline rest.
10. In-Depth Case Studies
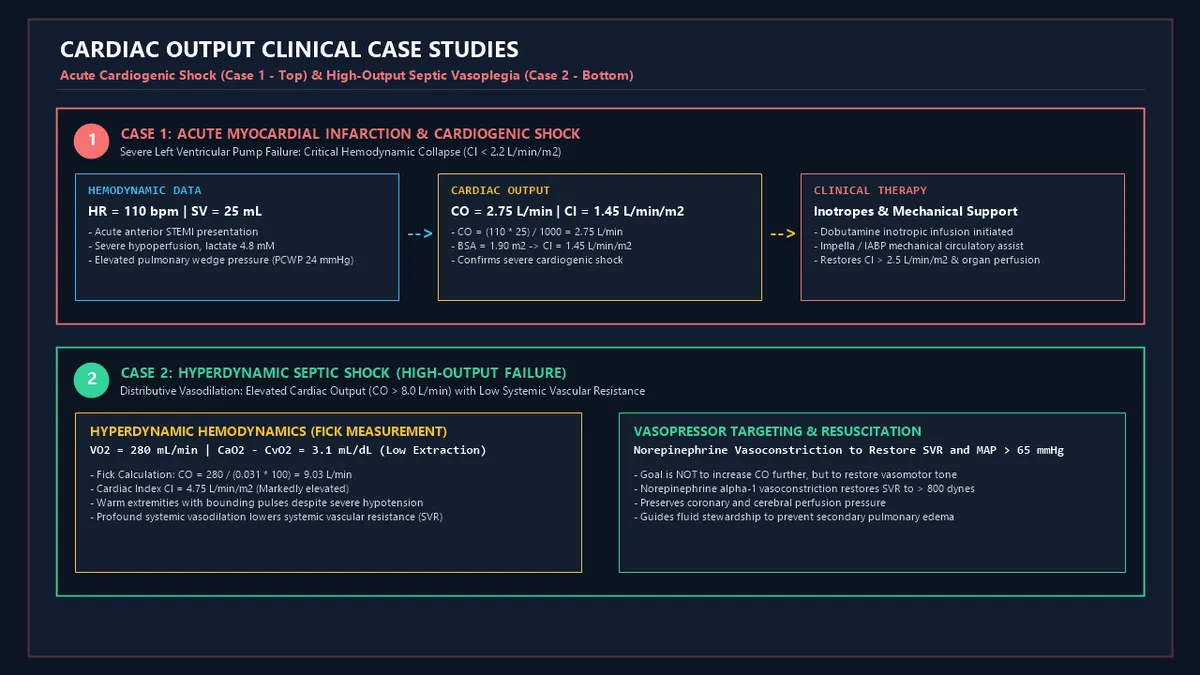
Case Study 1: Acute Myocardial Infarction & Cardiogenic Shock
- Patient Presentation: A male suffers an acute anterior ST-segment elevation myocardial infarction () involving proximal LAD occlusion.
- Initial Hemodynamics:- (compensatory sinus tachycardia)- (massive anterior wall akinesis)-- (Severe pump failure)- , ,
- Clinical Intervention:- Emergency percutaneous coronary intervention () with stent placement.- Placement of a microaxial transvalvular blood pump (Impella CP) providing of mechanical forward flow.- Dobutamine inotropic infusion initiated at .
- Resolution: Forward Cardiac Index restored to , with full clearance of serum lactate within 24 hours.
Case Study 2: Hyperdynamic Septic Shock (High-Output Failure)
- Patient Presentation: A female in the medical ICU develops urosepsis with high fevers, bounding peripheral pulses, and warm extremities despite severe hypotension (, ).
- Fick Oxygen Evaluation:- Oxygen uptake- , ,--- Arteriovenous Difference-- (Hyperdynamic state)- (Severe vasoplegia)
- Clinical Management:- Volume resuscitation combined with high-dose Norepinephrine () vasoconstriction to restore systemic vascular resistance to and maintain .
11. Advantages of Comprehensive Cardiac Output Quantification
- Targeted Shock Resuscitation: Prevents hazardous fluid overload in cardiogenic shock while guaranteeing adequate intravascular volume in distributive shock.
- Precision Drug Titration: Guides fine adjustments of inotropes (Milrinone, Dobutamine), vasopressors (Norepinephrine, Vasopressin), and afterload-reducing vasodilators (Nitroprusside).
- Prognostic Survival Stratification: Cardiac Power Output () identifies patients who require immediate mechanical circulatory support.
- Optimization of Cardiopulmonary Bypass Weaning: Ensures safe physiological cardiac indices before decannulation in cardiothoracic surgery.
12. Methodological Complexities & Clinical Artifacts
- Tricuspid Regurgitation in Thermodilution: Severe backflow across the tricuspid valve creates recirculation of the cold saline bolus, artificially delaying temperature recovery and falsely underestimating true cardiac output.
- Assumed vs. Measured in the Fick Principle: Using standard population nomograms (Lafarge-Miettinen formula) instead of directly measuring expired gas can introduce up to 25% error in critically ill patients with severe metabolic derangements.
- Severe Hypothermia & Rapid Infusions: Rapid administration of cold intravenous crystalloids creates thermal baseline drift, distorting the thermodilution integration curve.
13. Common Mistakes to Avoid
1. Assuming Normal Blood Pressure Equals Normal Cardiac Output:
Severe vasoconstriction () can maintain an apparently normal blood pressure () even when cardiac output has dropped into severe cardiogenic failure ().
2. Ignoring Body Surface Area Normalization:
An absolute cardiac output of is completely normal for a woman (), but indicates severe cardiogenic failure in a male ().
3. Misinterpreting Elevated Mixed Venous Saturation ():
In severe septic shock, cellular mitochondrial dysfunction (cytopathic hypoxia) and microvascular shunting prevent tissues from extracting oxygen, causing high despite tissue starvation.
12. Frequently Asked Questions (FAQ)
What is the normal cardiac output for a healthy adult at rest?
The normal resting cardiac output for a healthy adult is (averaging for a adult at a heart rate of and stroke volume of ).
What is the difference between Cardiac Output and Cardiac Index?
Cardiac Output () is the absolute volume of blood pumped per minute (). Cardiac Index () normalizes cardiac output to the individual's Body Surface Area (), allowing direct clinical comparison between patients of differing physical sizes.
Why is the Fick Principle considered the gold standard?
The Fick Principle is grounded in the conservation of mass and is unaffected by cardiac valve regurgitation (such as severe tricuspid or mitral insufficiency) or cardiac arrhythmias, which often compromise thermodilution and pulse contour methods.
How does exercise increase cardiac output?
During strenuous exercise, cardiac output increases up to through a combination of increased sympathetic heart rate (up to ), enhanced myocardial contractility, and increased venous return (the skeletal muscle pump).
What is Cardiac Power Output (CPO)?
Cardiac Power Output is the hydraulic work rate performed by the heart, calculated as (Watts). In the SHOCK trial, a was the single strongest independent predictor of in-hospital mortality.
How does Doppler echocardiography measure stroke volume?
Echocardiographers measure the cross-sectional area of the Left Ventricular Outflow Tract () and multiply it by the Velocity Time Integral () of blood flow measured via pulsed-wave Doppler ().
What causes a high-output cardiac failure state?
High-output cardiac failure occurs when tissues demand abnormally high blood flow due to decreased systemic vascular resistance or impaired oxygen carrying capacity, commonly triggered by hyperdynamic septic shock, severe chronic anemia, thyrotoxicosis, beriberi (thiamine deficiency), and arteriovenous malformations.
15. Expert Tips for Intensivists, Cardiologists & Physiologists
- Calculate Cardiac Power Output in Cardiogenic Shock: In patients with acute decompensated heart failure or post-infarction shock, calculate . If , escalate promptly to mechanical circulatory support (Impella, ECMO).
- Cross-Check Arteriovenous Oxygen Difference: When validating cardiac output measurements, check . A widening extraction difference () indicates progressive hypoperfusion, whereas a narrow difference () points toward hyperdynamic sepsis or microvascular shunting.
- Use Velocity Time Integral (VTI) for Dynamic Fluid Responsiveness: A increase in LVOT VTI following a passive leg raise test () confirms that the patient is preload responsive and will benefit from intravenous crystalloid administration.
16. Summary Checklist
- ✔ Measure Baseline Parameters: Record Heart Rate () and Stroke Volume () or Blood Gas saturations ().
- ✔ Calculate Absolute Cardiac Output: Solve for in .
- ✔ Calculate Mosteller BSA: Compute .
- ✔ Determine Cardiac Index (CI): Verify that falls within the normal physiological range ().
- ✔ Evaluate SVR and MAP: Calculate vascular resistance to classify shock into Cardiogenic vs. Distributive.
- ✔ Calculate Cardiac Power Output (CPO): Verify hemodynamic pump performance in ICU shock management.
Additional Technical Guidelines & Measurement Standards
When conducting calculations for Cardiovascular Cardiac Output Solver, maintaining quantitative precision and verifying input parameter boundaries is essential for reliable scenario evaluation. Always verify that raw numerical inputs are measured using standardized instrumentation, and double-check unit conversions prior to applying outputs in commercial, industrial, or academic projects.
For quantitative unit conversions and scientific calculations, always maintain at least four decimal places of precision during intermediate arithmetic stages before rounding final results. When preparing technical reports, laboratory documentation, or financial forecasts, cross-verify all output variables against established international measurement standards (such as SI, NIST, and ISO metric benchmarks) to guarantee consistent analytical rigor across all computational workflows.
MathsLover.com delivers this interactive solver 100% free of charge to foster global mathematical literacy, educational accessibility, and data-driven problem solving across scientific, technical, and academic communities worldwide.