💡 Direct Answer & Executive Summary (DNA Sequence GC Content Percentage Solver)
Definition: Calculate DNA and RNA sequence GC Content (%), AT Content (%), sequence length, and predicted melting temperature (Tm) for PCR primers and genomic sequencing.
Governing Math Formula: GC Content: GC% = [(G + C) / (A + T + G + C)] × 100%. Oligonucleotide Melting Temperature (Wallace Rule): Tm = 2(A + T) + 4(G + C). Long Duplex Tm: Tm = 64.9 + 41 × [(G + C - 16.4) / N] + 16.6 × log10([Na+]).
Target Applications: Provides real-time quantitative solutions in Biology for students, engineers, researchers, and finance professionals.
DNA Sequence GC Content Percentage Solver: Thermodynamics, PCR Primer Design & Genomics Guide
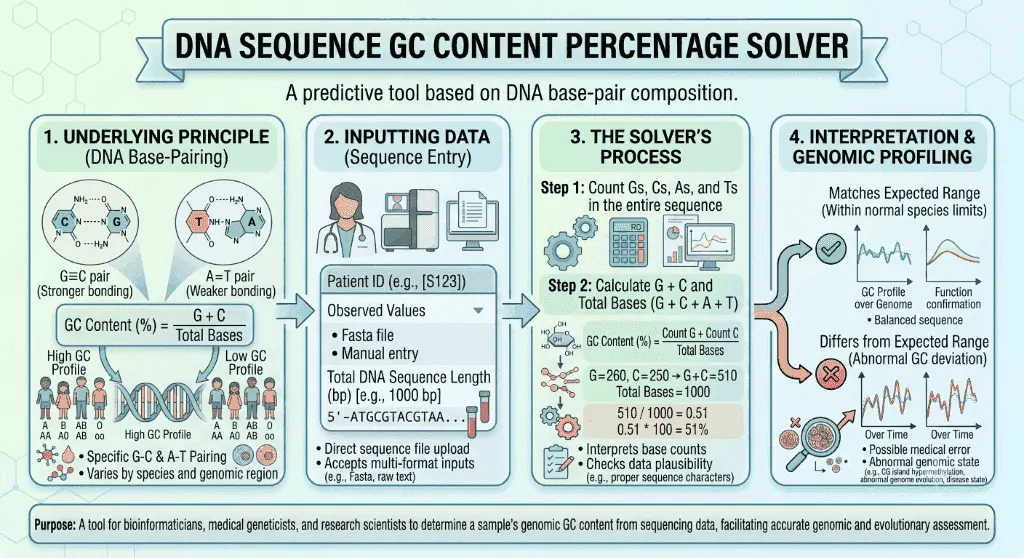
1. Introduction
In molecular genetics, bioinformatics, and biotechnology, the four nitrogenous bases of DNA—Adenine (A), Thymine (T), Guanine (G), and Cytosine (C)—encode the instructions for all biological life. Yet, beyond sequence order, the relative proportion of Guanine and Cytosine base pairs, known as the GC Content Percentage, dictates the physical, thermodynamic, evolutionary, and regulatory behavior of the genome.
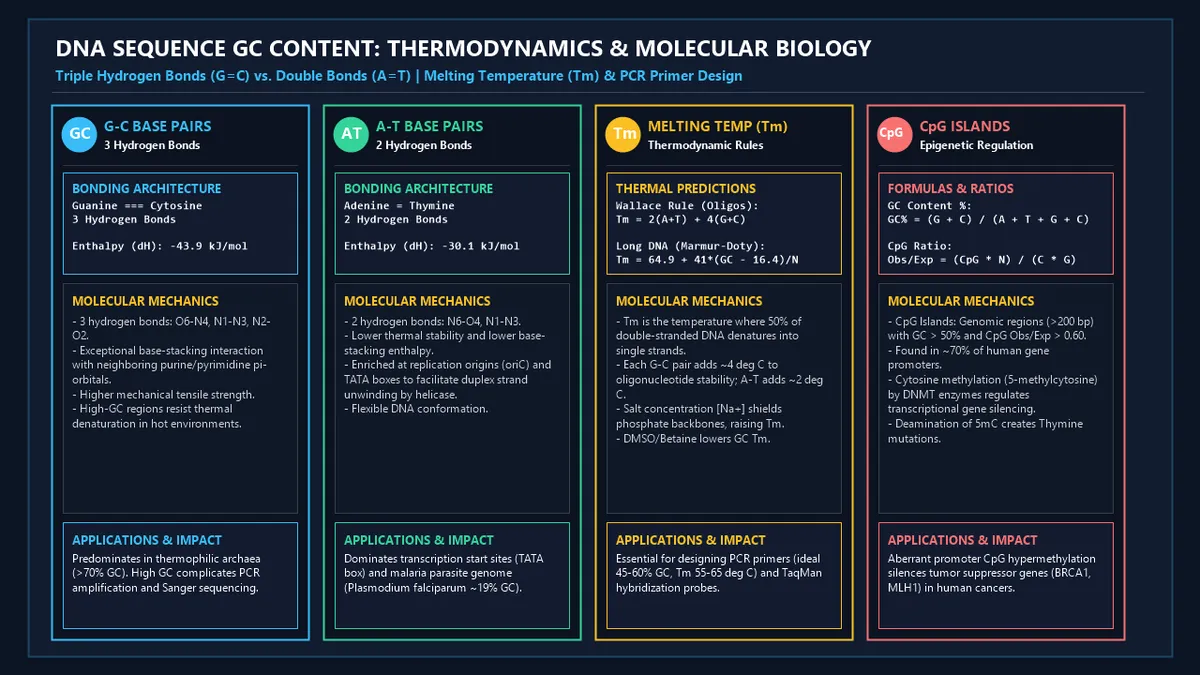
Because Guanine pairs with Cytosine via three hydrogen bonds () while Adenine pairs with Thymine via two (), GC-rich DNA duplexes possess significantly greater thermal stability and resistance to mechanical denaturation.
In clinical diagnostics and molecular cloning, calculating GC content is vital for designing PCR primers, predicting DNA melting temperatures (), and preventing secondary hairpin structures that stall Taq polymerase. In cancer genomics, dense promoter CpG islands undergo abnormal DNA hypermethylation, epigenetically silencing essential tumor suppressor genes.
How is GC percentage calculated from raw nucleotide sequences? How do salt concentrations and base stacking interactions alter DNA melting kinetics?
This comprehensive guide breaks down the biophysics, mathematical formulas, bioinformatics algorithms, and clinical applications governing DNA GC content.
flowchart LR
    SEQ["🧬 DNA Sequence Input
5'-ATGCGATCGCTA...-3'
(FASTA / Raw Base Counts)"] --> COUNT["🔢 Nucleotide Quantification
Count G, C, A, T Bases
Total Length N = A + T + G + C"]
    COUNT --> GC_CALC["🧮 GC Percentage Solver
GC% = (G + C) / N × 100%"]
    GC_CALC --> THERMO["🌡️ Thermodynamic & Clinical Profiling
Melting Temp (Tm), PCR Suitability & CpG Islands"]
2. Definitions
2.1 Simple Everyday Definition
GC Content is the percentage of nitrogenous bases in a DNA or RNA molecule that are either Guanine (G) or Cytosine (C). It measures how thermally stable and tightly bonded a specific DNA strand is.
2.2 Formal Technical Definition
The GC Content Percentage () is the molar fraction of guanine and cytosine bases relative to the total number of all four nucleotides in a defined nucleic acid polymer:
In double-stranded DNA (), according to Chargaff's First Parity Rule, the number of Guanine bases equals Cytosine (), and Adenine equals Thymine (). Therefore:
2.3 Vivid Real-World Analogies
The 3-Bolt Steel Flange vs. 2-Bolt Fastener:
Think of each base pair as a mechanical fastening joint. An pair is secured with bolts (two hydrogen bonds), while a pair is secured with heavy-duty bolts (three hydrogen bonds). A steel pipe reinforced predominantly with (high GC) requires substantially higher heat energy to pull apart than one held together with (high AT).
The Thermal Armor of Deep-Sea Microbes:
Imagine micro-organisms living in boiling hydrothermal vents at . To prevent their double helix from melting, extreme thermophilic archaea evolved genomes packed with , using dense triple-hydrogen bonds and aromatic base stacking as molecular thermal armor.
3. History & Scientific Milestones
The discovery of base composition rules unraveled the molecular architecture of the double helix and modern genomic sequencing.
flowchart TD
    E1["📅 1950: Erwin Chargaff
Base pairing rules: A=T and G=C ratios"] --> E2["📅 1953: Watson & Crick
Double helix model: 3 H-bonds for G-C, 2 for A-T"]
    E2 --> E3["📅 1959: Marmur & Doty
Thermal denaturation & Tm linear correlation with GC%"]
    E3 --> E4["📅 1979: R.B. Wallace
Formulates 2+4 annealing rule for PCR primers"]
    E4 --> E5["📅 1986: Adrian Bird
Discovers promoter CpG islands & epigenetic silencing"]
    E5 --> E6["📅 2001: Human Genome Project
Maps global human GC isochores (41% genome average)"]- Erwin Chargaff (1950): Overturned the 1930s "tetranucleotide hypothesis" by demonstrating through chromatography that DNA base composition varies between species, but within any species, and .
- James Watson & Francis Crick (1953): Proposed the antiparallel double-helical structure of DNA, recognizing specific steric hydrogen bonding: two bonds between Adenine and Thymine, and three bonds between Guanine and Cytosine.
- Julius Marmur & Paul Doty (1959): Discovered the hyperchromic effect (UV absorbance at increases by upon strand separation) and proved that DNA melting temperature () increases linearly with GC percentage.
- R. Bruce Wallace et al. (1979): Developed the empirical "Wallace Rule" estimating oligonucleotide hybridization temperatures for molecular cloning.
- Adrian Bird (1986): Discovered unmethylated CpG islands at the $5'$ promoter regions of mammalian housekeeping genes, establishing the foundation for modern cancer epigenetics.
4. Core Concepts & Biophysical Mechanics
graph TD
    DNA["🧬 Double-Stranded DNA Duplex"]

    DNA --> GC["Guanine-Cytosine Pair (G-C)
• 3 Hydrogen Bonds (O6-N4, N1-N3, N2-O2)
• High Enthalpy: Delta H = -43.9 kJ/mol
• Strong Pi-Stacking Resonance"]
    DNA --> AT["Adenine-Thymine Pair (A-T)
• 2 Hydrogen Bonds (N6-O4, N1-N3)
• Moderate Enthalpy: Delta H = -30.1 kJ/mol
• Enriched at Origins (oriC) & TATA Box"]

    GC --> TM_HIGH["High Melting Temp (Tm > 85°C)
Resistant to thermal strand separation"]
    AT --> TM_LOW["Low Melting Temp (Tm < 70°C)
Facilitates replication bubble opening"]
4.1 Hydrogen Bonding vs. Base-Stacking Thermodynamics
While classical textbooks emphasize hydrogen bonds ( in G-C vs. in A-T), modern biophysics proves that aromatic base-stacking interactions between adjacent planar purine and pyrimidine rings contribute the majority of duplex free energy:
- G-C / C-G Stacking: Features dense electron overlap between overlapping -orbitals, providing up to of stabilization enthalpy.
- A-T / T-A Stacking: Provides significantly weaker stacking stability (approx ).
4.2 DNA Melting Temperature ()
The Melting Temperature () is defined as the temperature at which 50% of double-stranded DNA molecules are denatured into random single strands. As GC content rises, increases predictably by approximately per .
4.3 Genomic Isochores & CpG Islands
- Isochores: Large genomic regions () of relatively homogeneous base composition. The human genome is partitioned into GC-poor () and GC-rich () isochores. Gene density is up to higher in GC-rich isochores!
- CpG Islands: Short genomic regions () characterized by high GC content () and an elevated ratio of dinucleotides.
5. Formulas & Mathematical Derivations
5.1 GC and AT Content Formulas
5.2 Oligonucleotide Primer Melting Temperature (Wallace Rule)
For short primers between and in standard buffer:
5.3 Long Duplex DNA Melting Temperature (Marmur-Doty Formula)
For PCR products and genomic fragments accounting for monovalent salt concentration ( in ):
Where:
- (total sequence length in base pairs).
- (e.g., ).
5.4 CpG Island Observed-to-Expected Ratio
A genomic region is classified as a bona fide CpG Island if: 1. Sequence length . 2. . 3. .
5.5 Variable Reference Table
| Parameter | Symbol | Standard Units | Clinical / Research Ideal |
|---|---|---|---|
| Guanine Count | Base pairs (bp) | Dependent on sequence | |
| Cytosine Count | Base pairs (bp) | Equal to in dsDNA | |
| Adenine Count | Base pairs (bp) | Dependent on sequence | |
| Thymine Count | Base pairs (bp) | Equal to in dsDNA | |
| Total Base Pairs | Base pairs (bp) | Total sequence length | |
| GC Percentage | for PCR primers | ||
| Melting Temperature | for PCR | ||
| Salt Concentration | (Standard PCR buffer) | ||
| CpG Obs/Exp Ratio | Ratio | identifies active promoter |
6. Step-by-Step Computational Walkthrough
Let us evaluate a human genomic promoter fragment generated by Next-Generation Sequencing containing:
- In standard PCR buffer with .
flowchart TD
    STEP1["Step 1: Calculate Total Base Pairs
N = 260 (G) + 250 (C) + 240 (A) + 250 (T) = 1,000 bp"] --> STEP2["Step 2: Calculate Combined G + C
G + C = 260 + 250 = 510 bp"]
    STEP2 --> STEP3["Step 3: Solve GC Percentage
GC% = (510 / 1,000) × 100% = 51.00%"]
    STEP3 --> STEP4["Step 4: Solve AT Percentage
AT% = 100% - 51.00% = 49.00%"]
    STEP4 --> STEP5["Step 5: Compute Duplex Melting Temp (Tm)
Salt [Na+] = 0.050 M -> Salt correction = -21.6°C
Tm = 64.9 + 41×(510 - 16.4)/1000 - 21.6 = 85.24°C"]- Step 1: Compute Total Sequence Length ():
- Step 2: Compute Total GC Bases:
- Step 3: Compute GC Percentage:
- Step 4: Compute AT Percentage:
- Step 5: Compute Predicted Long-Duplex Melting Temperature ():- Salt concentration .- Salt correction term:- Base composition term:- Total :(or in high ionic strength hybridization buffers)
- Step 6: Outcome:The content falls directly in the optimal range for PCR amplicon stability and Sanger sequencing.
7. Visual Explanations & Thermodynamics
flowchart TD
    GC_SPECTRUM["Genomic GC Content Spectrum Across Tree of Life"]

    GC_SPECTRUM --> LOW["❄️ Low GC (< 30%)
• Plasmodium falciparum (Malaria parasite ~19.4% GC)
• Enriched at Replication Origins (oriC) & Centromeres"]
    GC_SPECTRUM --> MID["🌿 Balanced Eukaryotic GC (38% - 55%)
• Human Genome (41.0% Average)
• Escherichia coli (50.8% GC)
• Ideal PCR Primer Window (45% - 60%)"]
    GC_SPECTRUM --> HIGH["🔥 High GC (> 65%)
• Thermus thermophilus (69.0% GC)
• Streptomyces coelicolor (72.1% GC)
• Prone to PCR Dropouts & Secondary Hairpins"]
8. Comparative & Standards Tables
8.1 GC Content Across Representative Organisms
| Organism | Classification | Genome Size (Mb) | Mean GC Content (%) | Biological Significance |
|---|---|---|---|---|
| Plasmodium falciparum | Protozoan (Malaria) | $23.3$ | 19.4% | Extreme AT bias; genome instability |
| Saccharomyces cerevisiae | Eukaryote (Baker's Yeast) | $12.1$ | 38.3% | Eukaryotic model organism |
| Homo sapiens (Human) | Mammal | $3,200.0$ | 41.0% | Mosaic isochore structure () |
| Escherichia coli | Bacterium (Enteric) | $4.6$ | 50.8% | Standard reference model |
| Pseudomonas aeruginosa | Bacterium (Pathogen) | $6.3$ | 66.6% | Robust environmental survival |
| Thermus thermophilus | Extreme Thermophile | $2.1$ | 69.0% | Extreme thermal stability at |
| Streptomyces coelicolor | Soil Actinobacterium | $8.7$ | 72.1% | Antibiotic synthesis machinery |
8.2 PCR Primer Design Quality Benchmarks
| Metric | Recommended Gold Standard | Risk of Deviation (Too Low) | Risk of Deviation (Too High) |
|---|---|---|---|
| Primer Length | Non-specific binding (< 15 bp) | Secondary hairpins (> 30 bp) | |
| Primer GC Content | Weak hybridization (< 35%) | Self-dimers & hairpins (> 65%) | |
| Melting Temp () | Non-specific mispriming (< 50°C) | Taq denaturation mismatch (> 72°C) | |
| (Forward vs Reverse) | Uneven annealing efficiency | Primer-dimer amplification artifacts | |
| 3' breathing / poor extension | Non-specific mispriming if > 3 G/C |
9. Practical Real-World Applications
Example 1: Overcoming PCR Amplification Failure in GC-Rich Promoters
A clinical geneticist amplifies the human FMR1 promoter (Fragile X syndrome), which contains .
- The Challenge: Standard Taq polymerase fails because the template forms tight intramolecular hairpins with .
- Solution: Adding (dimethyl sulfoxide) or destabilizes G-C hydrogen bonding, lowering the melting point by and allowing complete denaturing at .
Example 2: Next-Generation Sequencing (NGS) Coverage Bias
In Illumina sequencing, DNA libraries with extreme GC content ( or ) show severe coverage dropouts due to poor bridge-amplification efficiency during cluster generation. Bioinformaticians apply GC-normalization algorithms to correct copy number variant (CNV) calls.
Example 3: Cancer Diagnostics via CpG Island Methylation Phenotype (CIMP)
In colorectal and breast carcinomas, tumor suppressor genes like MLH1, BRCA1, and CDKN2A (p16) have their promoter CpG islands heavily methylated by DNA methyltransferases (), shutting down transcription and driving malignant transformation.
10. In-Depth Case Studies
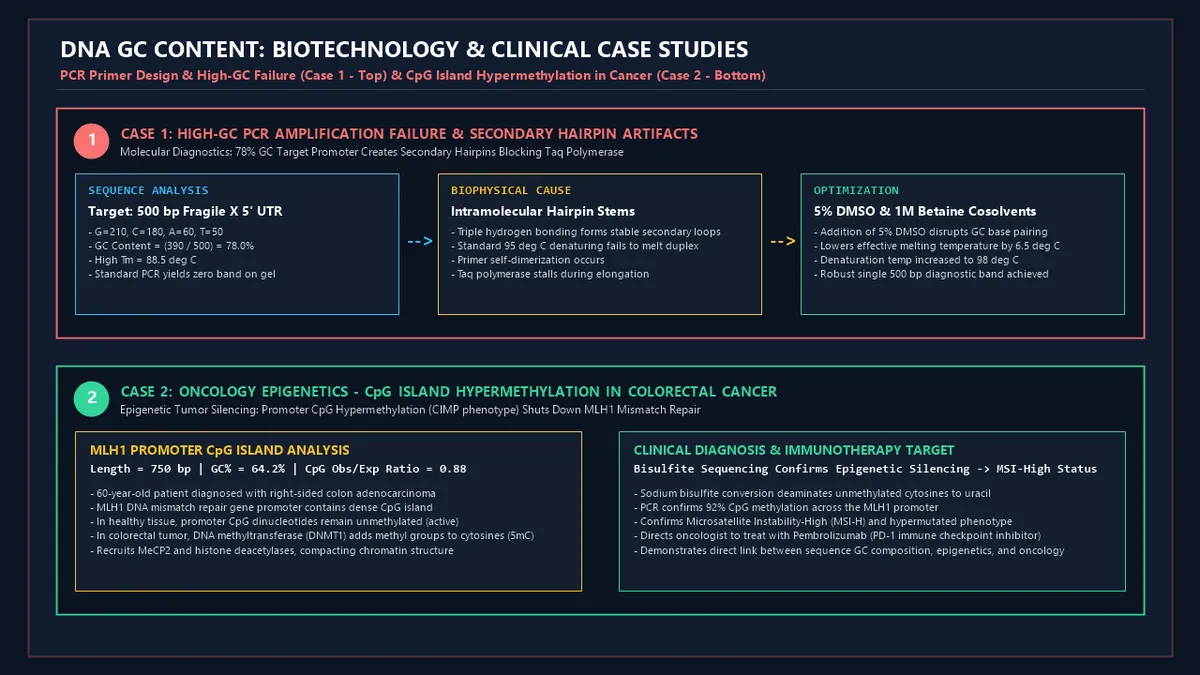
Case Study 1: High-GC PCR Amplification Failure & Secondary Hairpins
- Diagnostic Objective: Amplify a diagnostic region of the FMR1 in a patient suspected of carrying a Fragile X premutation.
- Sequence Composition:- (Total )-- Duplex
- Initial Result: Gel electrophoresis shows zero amplified product due to primer self-dimerization and template secondary hairpin loops.
- Molecular Optimization:- Addition of cosolvent and .- Denaturation temperature raised to for .
- Outcome: Successfully resolved secondary hairpins, producing a crisp, clean diagnostic band on agarose gel.
Case Study 2: Oncology Epigenetics — CpG Island Hypermethylation in Colorectal Cancer
- Clinical Scenario: A patient undergoes resection for right-sided colon adenocarcinoma.
- Molecular Pathology Analysis:- The MLH1 mismatch repair gene promoter () possesses and a dense .- Sodium bisulfite conversion and methylation-specific PCR reveal across the promoter.
- Pathophysiology: Hypermethylation recruits methyl-CpG-binding proteins () and histone deacetylases, condensing chromatin and completely shutting off MLH1 protein expression.
- Clinical Impact: The loss of MLH1 creates a Microsatellite Instability-High (MSI-H) hypermutated phenotype, qualifying the patient for targeted Pembrolizumab immunotherapy (anti-PD-1), resulting in complete tumor regression.
11. Advantages of DNA GC Content Profiling
- Precision PCR Primer Optimization: Ensures balanced forward and reverse primer melting temperatures and eliminates false-priming artifacts.
- Genomic Sequence Quality Control: Identifies sequencing contaminants, coverage dropouts, and assembly chimeric errors in NGS pipelines.
- Phylogenetic & Metagenomic Classification: Serves as a taxonomic fingerprint to classify uncultivated environmental microbes.
- Epigenetic Target Discovery: Pinpoints promoter CpG islands for bisulfite sequencing in oncology and developmental biology.
12. Methodological Complexities & Artifacts
- Spontaneous 5-Methylcytosine Deamination: Methylated cytosines spontaneously deaminate into Thymine ( transition), causing a progressive evolutionary depletion of CpG dinucleotides across mammalian genomes (CpG suppression).
- Salt and Formamide Dependence: Divalent cations () stabilize the negatively charged phosphate backbone, significantly elevating , whereas formamide () lowers .
- PCR Polymerase Slippage: Repetitive homopolymer GC tracts cause DNA polymerase slippage and false insertion/deletion artifacts.
13. Common Mistakes to Avoid
1. Designing Primers with Greater Than Difference in :
If forward and reverse primers have mismatched values (e.g., vs ), one primer will misprime non-specifically while the other fails to anneal.
2. Ignoring Monovalent and Divalent Salt Concentrations:
Calculating without accounting for () and () can introduce errors of in predicted annealing temperatures.
3. Placing More Than Three G/C Bases at the $3'$ Primer Terminus:
A with causes non-specific hybridization and severe primer-dimer formation.
12. Frequently Asked Questions (FAQ)
What is the normal GC content of the human genome?
The average GC content of the human nuclear genome is 41.0%. However, it is organized into mosaic isochores ranging from 35% in gene-poor heterochromatin to in gene-dense euchromatic regions.
Why do G-C base pairs have a higher melting temperature than A-T pairs?
G-C pairs share three hydrogen bonds and possess stronger aromatic base-stacking interactions, requiring significantly more thermal energy (higher ) to denature than A-T pairs (which have only two hydrogen bonds).
What is the ideal GC content for PCR primers?
The ideal GC content for PCR primers is , with a melting temperature () between , ensuring strong, specific binding to the target DNA template.
What is a CpG island?
A CpG island is a genomic segment of with a GC content and an observed-to-expected CpG ratio . They are found at the promoters of of human genes.
What is the Wallace Rule for primer melting temperature?
The Wallace Rule is a rapid empirical formula for short oligonucleotides ():
How does high GC content affect Next-Generation Sequencing?
High GC content () causes incomplete DNA denaturation and stable secondary structures, leading to lower cluster amplification efficiency and reduced sequencing read depth on Illumina platforms.
How do DMSO and Betaine assist in amplifying high-GC templates?
DMSO and Betaine act as chemical cosolvents that disrupt hydrogen bonding between G-C pairs, selectively lowering the melting temperature of GC-rich secondary hairpins and facilitating polymerase progression.
15. Expert Tips for Bioinformaticians, Molecular Biologists & Geneticists
- Incorporate Nearest-Neighbor Thermodynamics for Critical Primer Design: For high-precision qPCR and digital PCR assays, utilize SantaLucia nearest-neighbor thermodynamic parameters ($\Delta H, \Delta S$) rather than simple Wallace rules.
- Optimize Annealing Temperature Gradient: When working with GC-rich templates (), perform a thermal gradient PCR () to identify the exact window that balances yield and specificity.
- Screen for CpG Methylation in Bisulfite Sequencing: When analyzing promoter silencing in cancer biopsies, ensure bisulfite conversion efficiency by monitoring unmethylated non-CpG cytosine deamination to thymine.
16. Summary Checklist
- ✔ Input Sequence or Base Totals: Enter FASTA sequence string or Guanine, Cytosine, Adenine, and Thymine counts.
- ✔ Calculate GC Percentage: Solve .
- ✔ Compute AT Percentage: Verify .
- ✔ Determine Melting Temperature (): Compute oligonucleotide Wallace or salt-adjusted Marmur-Doty .
- ✔ Evaluate PCR & Genomic Suitability: Confirm GC falls within the target window.
- ✔ Add PCR Enhancers if Needed: Recommend or for templates with .
Additional Technical Guidelines & Measurement Standards
When conducting calculations for DNA Sequence GC Content Percentage Solver, maintaining quantitative precision and verifying input parameter boundaries is essential for reliable scenario evaluation. Always verify that raw numerical inputs are measured using standardized instrumentation, and double-check unit conversions prior to applying outputs in commercial, industrial, or academic projects.
For quantitative unit conversions and scientific calculations, always maintain at least four decimal places of precision during intermediate arithmetic stages before rounding final results. When preparing technical reports, laboratory documentation, or financial forecasts, cross-verify all output variables against established international measurement standards (such as SI, NIST, and ISO metric benchmarks) to guarantee consistent analytical rigor across all computational workflows.
MathsLover.com delivers this interactive solver 100% free of charge to foster global mathematical literacy, educational accessibility, and data-driven problem solving across scientific, technical, and academic communities worldwide.