💡 Direct Answer & Executive Summary (Compound Annual Growth Rate (CAGR) Calculator)
Definition: Compute values for Compound Annual Growth Rate (CAGR) Calculator inside the financial analytics domain.
Governing Math Formula: Standard industry financial equation for Compound Annual Growth Rate (CAGR) Calculator.
Target Applications: Provides real-time quantitative solutions in Finance for students, engineers, researchers, and finance professionals.
Compound Annual Growth Rate (CAGR) Calculator
1. Introduction
When tracking the performance of an investment portfolio, business sales, or economic indicators over several years, returns rarely remain flat or constant. In some years, a stock might jump by 20%, while in other years it might drop by 10%.
Because annual returns fluctuate, looking at a simple average can be misleading. To understand the true growth rate of your capital, you must calculate the rate as if the investment grew at a steady, compounded rate every year. This rate is known as the Compound Annual Growth Rate (CAGR).
The Compound Annual Growth Rate (CAGR) Calculator is an educational tool designed to simplify this evaluation. By entering your starting value and ending value, you can instantly estimate your CAGR percentage based on a standard 5-year default term.
This guide provides a comprehensive breakdown of CAGR mathematics, annual vs. compound returns, manual calculation guidelines, and investment scenarios.
graph TD
    A["Starting Investment Value"] --> C["Divide:
Ending Value / Starting Value"]
    B["Ending Investment Value"] --> C
    C --> D["Raise to the Power of 1/t (t = Term Years)"]
    D --> E["Subtract 1 & Multiply by 100"]
    E --> F["Result:
Compound Annual Growth Rate (CAGR) (%)"]
2. Core Definitions & Analogy
To build a solid financial foundation, let us define CAGR in both simple and technical terms:
- Simple Definition: CAGR is the constant annual rate at which your investment would have grown if it grew at the exact same rate every year, with interest compounding annually.
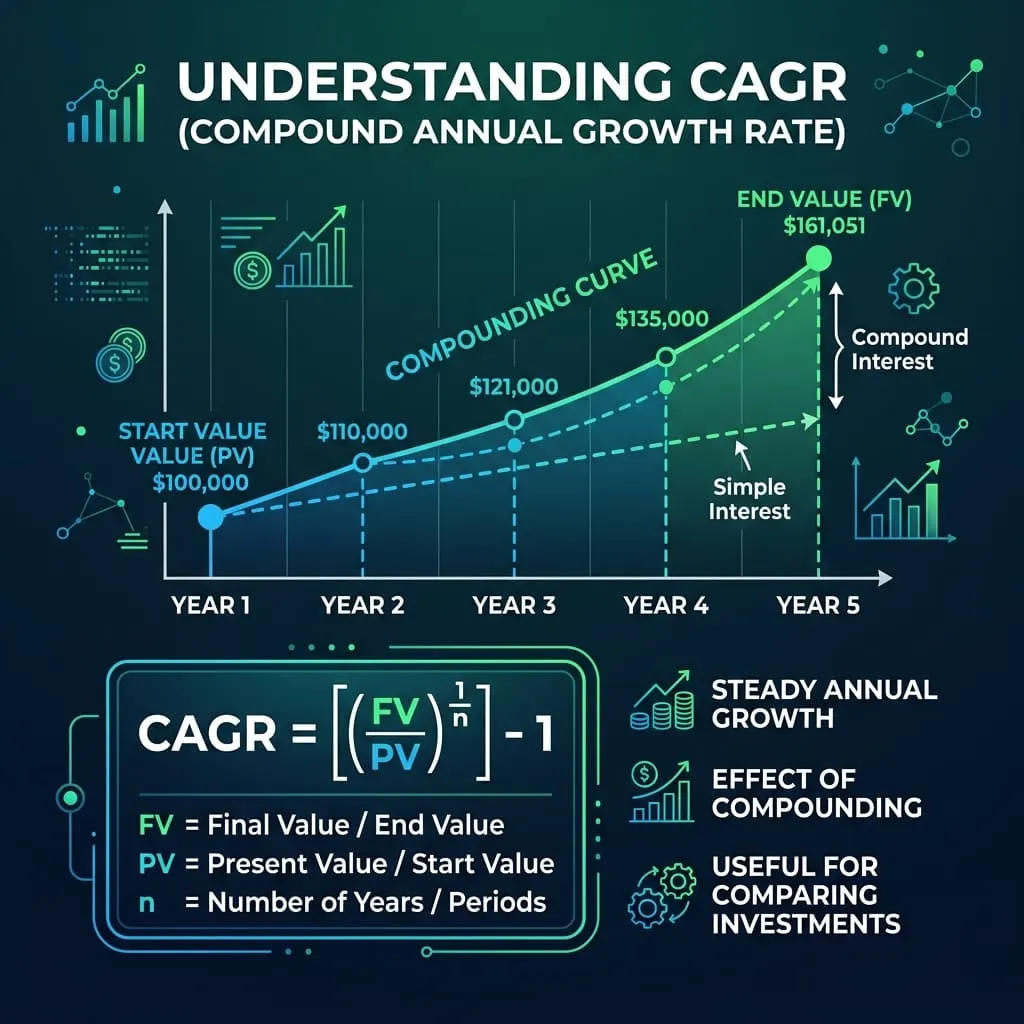
- Technical Definition: CAGR is the geometric progression ratio that provides a constant rate of return over a specified time period (t) from a starting value (V_start) to an ending value (V_end), expressed as CAGR = [ (V_end / V_start)^(1/t) - 1 ] * 100.
- Conceptual Analogy: Think of driving a car across a city. Along the way, you stop at traffic lights, accelerate on open roads, and slow down in school zones. Your actual speed changes every second. However, your GPS calculates your trip duration and distance to solve for a single, flat average speed for the entire drive. CAGR is that flat average speed for your investment's financial journey.
3. History & Milestones
The development of modern portfolio theory and corporate finance established CAGR as a standard investment metric:
- Ancient Merchant Tables: Early Italian and Dutch merchants calculated compound interest rates over multi-year voyages to determine shipping venture returns.
- Modern Portfolio Theory (1952): Harry Markowitz introduced risk-return optimization, highlighting geometric averages as the true measure of compound investment growth.
- Corporate Earnings Reports: Over the late 20th century, companies began using CAGR in their annual financial reports to show stable multi-year revenue growth trends to Wall Street investors.
4. Core Concepts & Parameters
To evaluate CAGR, you must understand three key parameters:
- Starting Value: The initial value of the asset, investment, or revenue at the beginning of the period.
- Ending Value: The final value of the asset, investment, or revenue at the end of the period.
- Term (t): The number of years elapsed between the starting and ending values (standardized at a default of 5 years in our system).
5. The Mathematical Model & Formula
The Compound Annual Growth Rate is solved using the geometric return equation:
CAGR Formula
CAGR = (Ending Value / Starting Value)^(1 / Term in Years) - 1
Variable Breakdown:
- Starting Value: The starting capital or revenue (USD)
- Ending Value: The final valuation or revenue (USD)
- Term: The number of years (Years, default t = 5)
Why the Formula Works:
Unlike simple interest, which is calculated only on the initial principal, CAGR accounts for compound growth (interest earning interest). Raising the ratio of the ending value to the starting value to the power of 1/t solves for the annual geometric mean of the investment's multi-year returns.
6. Step-by-Step Manual Procedure
Let us walk through a manual calculation using our default calculator values:
- Identify the variables:
Starting Value = $10,000Ending Value = $25,000Term (t) = 5 Years - Divide the Ending Value by the Starting Value:
Ending / Starting = 25,000 / 10,000 = 2.5Your capital grew by a factor of 2.5 over the term. - Raise the result to the power of 1/t (1 / 5 = 0.2):
2.5^0.2 = 1.20112 - Subtract 1 and multiply by 100 to get the percentage:
1.20112 - 1 = 0.201120.20112 * 100 = 20.11%Your Compound Annual Growth Rate is 20.11%.
7. Visual Diagram
The flowchart below displays the computation path for CAGR:
graph TD
    Start["Enter Starting Value, Ending Value, Term Years"] --> DivideVals["Divide:
Ending Value / Starting Value"]
    DivideVals --> PowerOf["Raise to the Power of 1 / Term Years"]
    PowerOf --> SubOne["Subtract 1 & Multiply by 100"]
    SubOne --> Display["Output: CAGR (%) based on Term"]
8. Parameter Comparison Matrix
The table below shows how the ending value affects the CAGR for a borrower with a $10,000 starting investment over a 5-year term:
| Starting Value | Ending Value | Total Multiplier | Term (t) | CAGR Percentage |
|---|---|---|---|---|
| $10,000 | $12,000 | 1.20x | 5 Years | 3.71% |
| $10,000 | $15,000 | 1.50x | 5 Years | 8.45% |
| $10,000 | $20,000 | 2.00x | 5 Years | 14.87% |
| $10,000 (Default) | $25,000 (Default) | 2.50x | 5 Years (Default) | 20.11% |
| $10,000 | $30,000 | 3.00x | 5 Years | 24.57% |
9. Real-World Applications
CAGR is a standard financial metric used across investments and corporate planning:
- Investment Portfolio Audits: Investors calculate CAGR to evaluate the long-term performance of their mutual funds and stock portfolios.
- Corporate Revenue Growth: Companies report their sales and revenue growth in terms of CAGR to show stable, long-term trends to investors.
- Business Valuation Analysis: Analysts use CAGR to project future cash flows based on historical growth rates.
10. Case Studies
Case Study 1: Comparing Volatile Stock Portfolios
An investor has two stock portfolios, both starting at $10,000 and ending at $15,000 after 5 years.
- Portfolio A: Grows steadily by 8.45% every year.
- Portfolio B: Jumps by 30% in year one, drops by 20% in year two, and fluctuates wildly until ending at $15,000.
- CAGR calculation: Both portfolios have the exact same starting value ($10,000) and ending value ($15,000) over 5 years.
CAGR = [ (15,000 / 10,000)^(1/5) - 1 ] * 100 = 8.45%
- Outcome: Even though Portfolio B was highly volatile, both portfolios achieved the exact same CAGR of 8.45%, allowing the investor to compare their long-term growth efficiency.
Case Study 2: Corporate Sales Revenue Trends
A technology startup reports its sales grew from $5 million to $20 million over 5 years.
- Calculation: Starting = 20M, Term = 5.
- CAGR calculation: \( (20 / 5)^{0.2} - 1 = 31.95\% \).
- Outcome: The startup's revenue grew at a CAGR of 31.95%, demonstrating strong and consistent growth to potential venture capital backers.
11. Advantages of Using the Tool
- Smooths Volatility: Calculates the true growth rate, bypassing annual fluctuations.
- Supports Comparisons: Helps you compare different assets (like stocks vs. gold) over identical timeframes.
- Enables Projections: Provides a reliable growth rate to project future asset values.
12. Limitations & Boundary Conditions
CAGR is a representative metric that assumes an investment grew at a constant, steady rate. It does not reflect the actual annual volatility or market dips that occurred during the investment period. It also does not account for mid-term capital additions or withdrawals.
13. Common Mistakes
- Confusing CAGR with Simple Average: Averaging the annual percentage changes will overestimate your growth rate due to volatility. Always use the geometric mean (CAGR).
- Ignoring the Time Factor: Assuming a high return is good without factoring in the number of years it took to achieve that return.
12. Frequently Asked Questions
Q1: What is Compound Annual Growth Rate (CAGR)?
The constant annual rate at which an investment would have grown if it grew at a steady, compounded rate every year.
Q2: What is the formula for CAGR?
The formula is CAGR = (Ending Value / Starting Value)^(1 / t) - 1, where t is the term in years.
Q3: How is CAGR different from simple average return?
Simple average return averages the annual changes directly. CAGR factors in compounding, providing the true annualized growth rate.
Q4: Can CAGR be negative?
Yes. If the ending value of your investment is lower than its starting value, the CAGR is negative, indicating a compound annual loss.
Q5: What is a good CAGR?
A good CAGR depends on the asset class. For the stock market, a long-term CAGR of 8% to 10% is considered strong.
Q6: Does CAGR include dividends?
Yes, if you reinvest your dividends into the asset, they increase the ending value and are included in the CAGR.
Q7: Why is CAGR popular in business reports?
Because it smooths out annual fluctuations, providing a clear trend of multi-year revenue growth.
Q8: What does "starting value" mean?
The initial valuation of the asset or investment at the beginning of the evaluation period.
Q9: Can I calculate CAGR over 1 year?
Yes, but over 1 year, CAGR is simply equal to the year's total return.
Q10: What does "compounded" mean?
It means that the returns earned in one period are added to the principal balance, earning additional returns in the next period.
15. Expert Tips
- Use CAGR to compare investments: Always compare the CAGR of different mutual funds or portfolios over the exact same timeframes to evaluate their relative performance.
- Factor in volatility: Remember that CAGR smooths out volatility. A portfolio with a high CAGR may have experienced significant market dips along the way.
16. Summary
- CAGR represents compound annual growth:
(Ending / Starting)^(1/t) - 1.
- CAGR smooths out annual fluctuations to show long-term trends.
- Simple averages overestimate investment returns; CAGR solves for the true geometric mean.
- CAGR is standard for comparing stock portfolios and corporate sales.
Additional Technical Guidelines & Measurement Standards
When conducting calculations for Compound Annual Growth Rate (CAGR) Calculator, maintaining quantitative precision and verifying input parameter boundaries is essential for reliable scenario evaluation. Always verify that raw numerical inputs are measured using standardized instrumentation, and double-check unit conversions prior to applying outputs in commercial, industrial, or academic projects.
For quantitative unit conversions and scientific calculations, always maintain at least four decimal places of precision during intermediate arithmetic stages before rounding final results. When preparing technical reports, laboratory documentation, or financial forecasts, cross-verify all output variables against established international measurement standards (such as SI, NIST, and ISO metric benchmarks) to guarantee consistent analytical rigor across all computational workflows.
MathsLover.com delivers this interactive solver 100% free of charge to foster global mathematical literacy, educational accessibility, and data-driven problem solving across scientific, technical, and academic communities worldwide.